HILo Ema Squeeze BandsThis indicator combines uses ema to identify price squeeze before a big move.
The ema gets initialised at new high low. It used 3 ema's lengths. For result use x, 2x ,4x ie 50, 100, 200 or 100,200,400 and so on . On more volatile asset use a higher settings like 100,200,400. The inner band is divided into 4 zones, which can give support resistance. As you use it you will become aware of subtle information that it can give at times. Like you may be able to find steps at which prices move, when the market is trending
Just like in Bollinger bands, in a trending market the price stays within sd=1 and sd=2 so does in the inner band the price will remain in band1 and band2. But Bollinger band cannot print steps this indicator shows steps
Cari dalam skrip untuk "support resistance"

Rev & Line - CoffeeKillerRev & Line - CoffeeKiller Indicator Guide
🔔 Warning: This Indicator Repaints 🔔 This indicator uses real-time calculations that may change based on future price action. As a result, signals (such as arrows, lines, or color changes) **can and will repaint** — meaning they may appear, disappear, or shift after a candle closes.
**Do not rely on this tool alone for live trading decisions.** Use with caution and always confirm with non-repainting tools or additional analysis.(This indicator is designed to show me the full length of the trend and because of this there can be a smaller movement inside of the trend movement)
Welcome traders! This guide will walk you through the Rev & Line indicator, a sophisticated technical analysis tool developed by CoffeeKiller that combines multiple methodologies to identify market pivots, trends, and potential reversal points.
Core Components
1. ZigZag Analysis
- Dynamic pivot detection using ATR (Average True Range)
- Customizable sensitivity through ATR Reversal Factor
- Color-coded trend lines (green for upward, red for downward)
- Optional vertical lines at pivot points
- Real-time pivot point analysis
2. Donchian Channel Integration
- Traditional upper, lower, and middle bands
- Customizable length and displacement
- Channel-based entry signals
- Dynamic market structure visualization
3. Marker Lines System
- Dynamic support/resistance level tracking
- Pivot-based reset mechanism
- Optional fill zones between markers
- Percentage position tracking within range
4. Signal Generation System
- Confluence between ZigZag pivots and Donchian channels
- Up/down arrow visualization
- Alert system
Main Features
ZigZag Settings
- ATR Reversal Factor: Controls pivot sensitivity (default 3.2)
- Customizable line appearance:
Width control (default: 3)
Color selection (green for uptrend, red for downtrend)
Vertical line options at pivot points
Maximum vertical lines display limit
- Hide repainted option for more reliable signals
Donchian Channel Configuration
- Optional channel visibility toggle
- Length parameter for lookback period (default: 20)
- Displace option for time offset
- Bubble offset for visual placement
Marker Lines System
- High/low/middle marker lines with step-line visualization
- Dotted line projections for future reference
- Pivot-based reset mechanism
- Color-coded percentage position display
Signal Generation
- Triangle markers for signals
- Combined ZigZag and Donchian confluence
- Alert system for notifications
Visual Elements
1. Pivot Lines
- Green: Upward price movements
- Red: Downward price movements
- Customizable line width
- Optional vertical pivot markers with style options:
Solid lines for confirmed pivots
Dashed lines for older pivots
Dotted lines for most recent pivots
2. Donchian Channels
- Upper band (red): Resistance level
- Lower band (green): Support level
- Middle band (yellow): Median price line
- Customizable display options
3. Marker Lines
- High marker line (magenta): Tracks highest open price
- Low marker line (cyan): Tracks lowest open price
- Middle marker line (blue): 50% level between high/low
- Dotted line extensions for future price projections
4. Position Tracking
- Percentage position display within marker range
- Real-time calculations from 0% to 100%
- Label system for visual reference
Trading Applications
1. Trend Following
- Enter on confirmed ZigZag pivot points
- Use Donchian channel boundaries as targets
- Trail stops using marker lines
- Monitor for confluence between systems
2. Counter-Trend Trading
- Trade bounces from marker lines
- Use pivot confirmation for entry timing
- Set stops based on recent pivot points
- Target the opposite marker line
3. Range Trading
- Use high/low marker lines to define range
- Trade bounces between upper and lower markers
- Consider middle marker for range midpoint
- Monitor percentage position within range
4. Breakout Trading
- Enter on breaks above/below marker lines
- Confirm with Donchian channel breakouts
- Use ZigZag pivot confirmations
- Wait for arrow signals for additional confirmation
Optimization Guide
1. ZigZag Parameters
- Higher ATR Factor: Less sensitive, major moves only
- Lower ATR Factor: More sensitive, catches minor moves
- Adjust line width for chart visibility
- Balance vertical line count for clarity
2. Donchian Channel Settings
- Longer length: Smoother channels, fewer false signals
- Shorter length: More responsive, but potentially noisier
- Displacement: Offset for historical reference
- Consider timeframe when setting parameters
3. Marker Line Configuration
- Enable/disable based on trading style
- Toggle middle line for additional reference
- Adjust colors for visual clarity
- Enable/disable labels as needed
4. Signal Generation
- Use "Hide repainted" option for more reliable signals
- Combine ZigZag and Donchian signals for confirmation
- Set alerts based on confirmed pivot points
- Balance sensitivity with reliability
Best Practices
1. Signal Confirmation
- Wait for confirmed pivot points
- Check for Donchian channel interactions
- Confirm with price action
- Look for arrow signals at pivot points
2. Risk Management
- Use recent pivot points for stop placement
- Consider marker line boundaries for targets
- Don't trade against strong trends
- Wait for clear confluence between systems
3. Setup Optimization
- Start with default settings
- Adjust based on timeframe
- Fine-tune ATR sensitivity
- Match settings to trading style
Advanced Features
1. Alert System
- Customizable arrow alerts
- Pivot point notifications
- Text message alerts with ticker information
- Once-per-bar frequency option
2. Pivot Detection Logic
The indicator uses a sophisticated state-based approach to detect pivots:
- State transitions between "uptrend," "downtrend," and "undefined"
- ATR-based reversal detection
- Minimum movement threshold for pivot confirmation
- Historical pivot tracking and labeling
3. Marker Line Reset Mechanism
- Marker lines reset based on pivot detection
- Dynamic support/resistance level adjustment
- Percentage position calculation within range
- Automatic updates as market structure changes
Remember:
- Combine multiple confirmation signals
- Use appropriate timeframe settings
- Monitor both ZigZag and Marker signals
- Pay attention to Donchian channel interactions
- Consider market volatility when trading
This indicator works best when:
- Used with proper risk management
- Combined with other technical tools
- Applied to appropriate timeframes
- Signals are confirmed by price action
**DISCLAIMER**: This indicator and its signals are intended solely for educational and informational purposes. They do not constitute financial advice. Trading involves significant risk of loss. Always conduct your own analysis and consult with financial professionals before making trading decisions.

MTF Fibonacci Pivots with Mandelbrot FractalsMTF Fibonacci Pivots with Mandelbrot Fractals: Advanced Market Structure Analysis
Overview
The MTF Fibonacci Pivots with Mandelbrot Fractals indicator represents a significant advancement in technical analysis by combining multi-timeframe Fibonacci pivot levels with sophisticated fractal pattern recognition. This powerful tool identifies key support and resistance zones while predicting potential price reversals with remarkable accuracy.
Key Capabilities
This indicator provides traders with three distinct layers of market structure analysis:
Automatic Timeframe Adaptation: The primary pivot set automatically adjusts to your chart's timeframe, ensuring relevant support and resistance levels for your specific trading horizon.
1-Year Fibonacci Pivots: The second layer displays yearly pivots that reveal long-term market cycles and institutional price levels that often act as significant reversal points.
3-Year Fibonacci Pivots: The third layer unveils major market structure zones that typically remain relevant for extended periods, offering strategic context for position trading and long-term investment decisions.
Predictive Technology
What truly distinguishes this indicator is its advanced predictive capability powered by:
Mandelbrot Fractal Pattern Recognition: The indicator implements a sophisticated fractal detection algorithm that identifies recurring price patterns across multiple timeframes. Unlike conventional fractal indicators, it incorporates noise filtering and adaptive sensitivity to market volatility.
Tesla's 3-6-9 Principle Integration: The system incorporates Nikola Tesla's mathematical principle through a cubic Mandelbrot equation (Z_{n+1} = Z_n^3 + C where Z_0 = 0), creating a unique approach to pattern recognition that aligns with natural market rhythms.
Historical Pattern Matching: When a current price pattern exhibits strong similarity to historical formations, the indicator generates predictive targets with confidence ratings. Each prediction undergoes rigorous validation against multiple parameters including trend alignment, volatility context, and mathematical coherence.
Visual Intelligence System
The indicator's visual presentation enhances trading decision-making through:
Confidence-Based Visualization: Predictions display with intuitive star ratings, percentage confidence scores, and contextual information including price movement magnitude and estimated time to target.
Adaptive Color Harmonization: The color system intelligently adjusts to provide optimal visibility while maintaining a professional appearance suitable for any chart setup.
Trend Alignment Indicators: Each prediction includes references to the broader trend context, helping traders avoid counter-trend trades unless the reversal signal carries exceptional strength.
Strategic Applications
This indicator excels in multiple trading scenarios:
Intraday Trading: Identify high-probability reversal zones with precise timing
Swing Trading: Anticipate significant market turns at key structural levels
Position Trading: Recognize major cycle shifts for strategic entry and exit
The automatic 1-year and 3-year Fibonacci pivots provide institutional-grade reference points that typically define major market movements. These longer timeframes reveal critical zones that might be invisible on shorter-term analysis, giving you a significant edge in understanding where price is likely to encounter substantial buying or selling pressure.
This innovative approach to market analysis combines classical Fibonacci mathematics with cutting-edge fractal theory to create a comprehensive market structure visualization system that illuminates both present support/resistance levels and future price targets with exceptional clarity.
Setting Up MTF Fibonacci Pivots with Mandelbrot Fractals
Initial Setup
Adding this indicator to your TradingView charts is straightforward:
Navigate to the "Indicators" button on your chart toolbar
Search for "MTF Fibonacci Pivots with Mandelbrot Fractals"
Select the indicator to add it to your chart
A configuration panel will appear with various setting categories
Recommended Settings
The indicator comes pre-configured with optimal default settings, but you may want to adjust them based on your trading style:
For Day Trading (Timeframes 1-minute to 1-hour)
Pivots Timeframe 1: Auto (automatically adapts to your chart)
Pivots Timeframe 2: Daily
Pivots Timeframe 3: Weekly
Fractal Sensitivity: 2-3
Fractal Lookback Period: 20
Prediction Strength: 2
Color Theme: High Contrast or Dark Mode
For Swing Trading (Timeframes 4-hour to Daily)
Pivots Timeframe 1: Daily
Pivots Timeframe 2: Weekly
Pivots Timeframe 3: Monthly
Fractal Sensitivity: 1-2
Fractal Lookback Period: 30
Prediction Strength: 2-3
Color Theme: Default or Dimmed
For Position Trading (Timeframes Daily to Weekly)
Pivots Timeframe 1: Weekly
Pivots Timeframe 2: Monthly
Pivots Timeframe 3: Quarterly
Fractal Sensitivity: 1
Fractal Lookback Period: 50
Prediction Strength: 1
Color Theme: Monochrome or Pastel
Restoring Default Settings
If you've adjusted settings and wish to return to the defaults:
Right-click on the indicator name on your chart
Select "Settings" from the context menu
In the settings dialog, look for the "Reset All" button at the bottom
Confirm the reset when prompted
Alternatively, you can remove the indicator and add it again for a fresh start with default settings.
Advanced Settings Guidance
Visual Appearance
Use Gradient Colors: Enable for better visual differentiation between pivot levels
Color Transparency: 15% provides an optimal balance between visibility and chart clutter
Line Width: 1-2 for cleaner charts, 3+ for enhanced visibility
Fractal Analysis
Enable Fractal Analysis: Keep enabled for prediction capabilities
Fractal Box Spacing: Higher values (5-10) for cleaner displays, lower values (1-3) for more signals
Maximum Forecast Bars: 20 is optimal for most timeframes, adjust higher for longer predictions
Performance Considerations
Enable Self-Optimization: Keep enabled to maintain smooth chart performance
Resource Priority: Use "Balanced" for most computers, "Performance" for older systems
Force Pivot Display: Enable only when checking specific historical periods
Common Setup Mistakes to Avoid
Setting all timeframes too close together (e.g., Daily, Daily, Weekly) reduces the multi-timeframe advantage
Using high fractal sensitivity (4+) on noisy markets creates excessive signals
Setting fractal box spacing too low causes cluttered prediction boxes
Disabling self-optimization may cause performance issues on complex charts
Using incompatible color themes for your chart background reduces visibility
The indicator's power comes from its default 1-year and 3-year Fibonacci pivot settings, which highlight institutional levels while the auto-timeframe setting adapts to your trading horizon. These carefully balanced defaults provide an excellent starting point for most traders.
For optimal results, I recommend making minimal adjustments at first, then gradually customizing settings as you become familiar with the indicator's behavior in your specific markets and timeframes.
Screenshots:

Adaptive Regression Channel [MissouriTim]The Adaptive Regression Channel (ARC) is a technical indicator designed to empower traders with a clear, adaptable, and precise view of market trends and price boundaries. By blending advanced statistical techniques with real-time market data, ARC delivers a comprehensive tool that dynamically adjusts to price action, volatility, volume, and momentum. Whether you’re navigating the fast-paced world of cryptocurrencies, the steady trends of stocks, or the intricate movements of FOREX pairs, ARC provides a robust framework for identifying opportunities and managing risk.
Core Components
1. Color-Coded Regression Line
ARC’s centerpiece is a linear regression line derived from a Weighted Moving Average (WMA) of closing prices. This line adapts its calculation period based on market volatility (via ATR) and is capped between a minimum of 20 bars and a maximum of 1.5 times the user-defined base length (default 100). Visually, it shifts colors to reflect trend direction: green for an upward slope (bullish) and red for a downward slope (bearish), offering an instant snapshot of market sentiment.
2. Dynamic Residual Channels
Surrounding the regression line are upper (red) and lower (green) channels, calculated using the standard deviation of residuals—the difference between actual closing prices and the regression line. This approach ensures the channels precisely track how closely prices follow the trend, rather than relying solely on overall price volatility. The channel width is dynamically adjusted by a multiplier that factors in:
Volatility: Measured through the Average True Range (ATR), widening channels during turbulent markets.
Trend Strength: Based on the regression slope, expanding channels in strong trends and contracting them in consolidation phases.
3. Volume-Weighted Moving Average (VWMA)
Plotted in orange, the VWMA overlays a volume-weighted price trend, emphasizing movements backed by significant trading activity. This complements the regression line, providing additional confirmation of trend validity and potential breakout strength.
4. Scaled RSI Overlay
ARC features a Relative Strength Index (RSI) overlay, plotted in purple and scaled to hover closely around the regression line. This compact display reflects momentum shifts within the trend’s context, keeping RSI visible on the price chart without excessive swings. User-defined overbought (default 70) and oversold (default 30) levels offer reference points for momentum analysis."
Technical Highlights
ARC leverages a volatility-adjusted lookback period, residual-based channel construction, and multi-indicator integration to achieve high accuracy. Its parameters—such as base length, channel width, ATR period, and RSI length—are fully customizable, allowing traders to tailor it to their specific needs.
Why Choose ARC?
ARC stands out for its adaptability and precision. The residual-based channels offer tighter, more relevant support and resistance levels compared to standard volatility measures, while the dynamic adjustments ensure it performs well in both trending and ranging markets. The inclusion of VWMA and scaled RSI adds depth, merging trend, volume, and momentum into a single, cohesive overlay. For traders seeking a versatile, all-in-one indicator, ARC delivers actionable insights with minimal noise.
Best Ways to Use the Adaptive Regression Channel (ARC)
The Adaptive Regression Channel (ARC) is a flexible tool that supports a variety of trading strategies, from trend-following to breakout detection. Below are the most effective ways to use ARC, along with practical tips for maximizing its potential. Adjustments to its settings may be necessary depending on the timeframe (e.g., intraday vs. daily) and the asset being traded (e.g., stocks, FOREX, cryptocurrencies), as each market exhibits unique volatility and behavior.
1. Trend Following
• How to Use: Rely on the regression line’s color to guide your trades. A green line (upward slope) signals a bullish trend—consider entering or holding long positions. A red line (downward slope) indicates a bearish trend—look to short or exit longs.
• Best Practice: Confirm the trend with the VWMA (orange line). Price above the VWMA in a green uptrend strengthens the bullish case; price below in a red downtrend reinforces bearish momentum.
• Adjustment: For short timeframes like 15-minute crypto charts, lower the Base Regression Length (e.g., to 50) for quicker trend detection. For weekly stock charts, increase it (e.g., to 200) to capture broader movements.
2. Channel-Based Trades
• How to Use: Use the upper channel (red) as resistance and the lower channel (green) as support. Buy when the price bounces off the lower channel in an uptrend, and sell or short when it rejects the upper channel in a downtrend.
• Best Practice: Check the scaled RSI (purple line) for momentum cues. A low RSI (e.g., near 30) at the lower channel suggests a stronger buy signal; a high RSI (e.g., near 70) at the upper channel supports a sell.
• Adjustment: In volatile crypto markets, widen the Base Channel Width Coefficient (e.g., to 2.5) to reduce false signals. For stable FOREX pairs (e.g., EUR/USD), a narrower width (e.g., 1.5) may work better.
3. Breakout Detection
• How to Use: Watch for price breaking above the upper channel (bullish breakout) or below the lower channel (bearish breakout). These moves often signal strong momentum shifts.
• Best Practice: Validate breakouts with VWMA position—price above VWMA for bullish breaks, below for bearish—and ensure the regression line’s slope aligns (green for up, red for down).
• Adjustment: For fast-moving assets like crypto on 1-hour charts, shorten ATR Length (e.g., to 7) to make channels more reactive. For stocks on daily charts, keep it at 14 or higher for reliability.
4. Momentum Analysis
• How to Use: The scaled RSI overlay shows momentum relative to the regression line. Rising RSI in a green uptrend confirms bullish strength; falling RSI in a red downtrend supports bearish pressure.
• Best Practice: Look for RSI divergences—e.g., price hitting new highs at the upper channel while RSI flattens or drops could signal an impending reversal.
• Adjustment: Reduce RSI Length (e.g., to 7) for intraday trading in FOREX or crypto to catch short-term momentum shifts. Increase it (e.g., to 21) for longer-term stock trades.
5. Range Trading
• How to Use: When the regression line’s slope is near zero (flat) and channels are tight, ARC indicates a ranging market. Buy near the lower channel and sell near the upper channel, targeting the regression line as the mean price.
• Best Practice: Ensure VWMA hovers close to the regression line to confirm the range-bound state.
• Adjustment: For low-volatility stocks on daily charts, use a moderate Base Regression Length (e.g., 100) and tight Base Channel Width (e.g., 1.5). For choppy crypto markets, test shorter settings.
Optimization Strategies
• Timeframe Customization: Adjust ARC’s parameters to match your trading horizon. Short timeframes (e.g., 1-minute to 1-hour) benefit from lower Base Regression Length (20–50) and ATR Length (7–10) for agility, while longer timeframes (e.g., daily, weekly) favor higher values (100–200 and 14–21) for stability.
• Asset-Specific Tuning:
○ Stocks: Use longer lengths (e.g., 100–200) and moderate widths (e.g., 1.8) for stable equities; tweak ATR Length based on sector volatility (shorter for tech, longer for utilities).
○ FOREX: Set Base Regression Length to 50–100 and Base Channel Width to 1.5–2.0 for smoother trends; adjust RSI Length (e.g., 10–14) based on pair volatility.
○ Crypto: Opt for shorter lengths (e.g., 20–50) and wider widths (e.g., 2.0–3.0) to handle rapid price swings; use a shorter ATR Length (e.g., 7) for quick adaptation.
• Backtesting: Test ARC on historical data for your asset and timeframe to optimize settings. Evaluate how often price respects channels and whether breakouts yield profitable trades.
• Enhancements: Pair ARC with volume surges, key support/resistance levels, or candlestick patterns (e.g., doji at channel edges) for higher-probability setups.
Practical Considerations
ARC’s adaptability makes it suitable for diverse markets, but its performance hinges on proper calibration. Cryptocurrencies, with their high volatility, may require shorter, wider settings to capture rapid moves, while stocks on longer timeframes benefit from broader, smoother configurations. FOREX pairs often fall in between, depending on their inherent volatility. Experiment with the adjustable parameters to align ARC with your trading style and market conditions, ensuring it delivers the precision and reliability you need.

Pivot Point Calculator PPC V2 by [KhedrFx]📈 Trade Smarter with the Pivot Point Calculator (PPC) by KhedrFx
Want to spot key price levels and make better trading decisions? The Pivot Point Calculator (PPC) by KhedrFx is your go-to TradingView tool for identifying potential support and resistance zones. Whether you’re a Scalper trader, day trader, swing trader, or long-term investor, this script helps you plan precise entries and exits with confidence.
🔹 How to Use Pivot Points in Trading
📊 Step 1: Identify Key Levels
The PPC automatically plots:
Pivot Point (P): The main level where sentiment shifts between bullish and bearish.
Support Levels (S1, S2, S3): Areas where price may bounce higher.
Resistance Levels (R1, R2, R3): Areas where price may face selling pressure.
These levels act as dynamic price zones, helping you anticipate potential market movements.
🔥 Step 2: Choose Your Trading Strategy
1️⃣ Breakout Trading
Buy when the price breaks above the pivot point (P) with strong momentum.
Sell when the price drops below the pivot point (P) with strong momentum.
Use R1, R2, or R3 as profit targets in an uptrend and S1, S2, or S3 in a downtrend.
2️⃣ Reversal (Bounce) Trading
Buy when the price pulls back to S1, S2, or S3 and shows bullish confirmation (e.g., candlestick patterns like a bullish engulfing or hammer).
Sell when the price rallies to R1, R2, or R3 and shows bearish confirmation (e.g., rejection wicks or a bearish engulfing pattern).
🎯 Step 3: Set Smart Stop-Loss & Take-Profit Levels
Stop-Loss: Place it slightly below support (for buy trades) or above resistance (for sell trades).
Take-Profit: Use the next pivot level as a target.
Extreme Zones: R3 and S3 often signal strong reversals or breakouts—watch them closely!
🚀 How to Get Started
1️⃣ Add the PPC script to your TradingView chart.
2️⃣ Choose a timeframe that fits your strategy (5m, 15m, 30m, 1H, 4H, Daily, or Weekly).
3️⃣ Use the pivot points and support/resistance levels to fine-tune your trade entries, exits, and risk management.
⚠️ Trade Responsibly
This tool helps you analyze the market, but it’s not a guarantee of profits. Always do your own research, manage risk, and trade with caution.
💡 Ready to take your trading to the next level? Try the Pivot Point Calculator (PPC) by KhedrFx and start trading with confidence today! 🚀

Rally Base Drop SND Pivots Strategy [LuxAlgo X PineIndicators]This strategy is based on the Rally Base Drop (RBD) SND Pivots indicator developed by LuxAlgo. Full credit for the concept and original indicator goes to LuxAlgo.
The Rally Base Drop SND Pivots Strategy is a non-repainting supply and demand trading system that detects pivot points based on Rally, Base, and Drop (RBD) candles. This strategy automatically identifies key market structure levels, allowing traders to:
Identify pivot-based supply and demand (SND) zones.
Use fixed criteria for trend continuation or reversals.
Filter out market noise by requiring structured price formations.
Enter trades based on breakouts of key SND pivot levels.
How the Rally Base Drop SND Pivots Strategy Works
1. Pivot Point Detection Using RBD Candles
The strategy follows a rigid market structure methodology, where pivots are detected only when:
A Rally (R) consists of multiple consecutive bullish candles.
A Drop (D) consists of multiple consecutive bearish candles.
A Base (B) is identified as a transition between Rallies and Drops, acting as a pivot point.
The pivot level is confirmed when the formation is complete.
Unlike traditional fractal-based pivots, RBD Pivots enforce stricter structural rules, ensuring that each pivot:
Has a well-defined bullish or bearish price movement.
Reduces false signals caused by single-bar fluctuations.
Provides clear supply and demand levels based on structured price movements.
These pivot levels are drawn on the chart using color-coded boxes:
Green zones represent bullish pivot levels (Rally Base formations).
Red zones represent bearish pivot levels (Drop Base formations).
Once a pivot is confirmed, the high or low of the base candle is used as the reference level for future trades.
2. Trade Entry Conditions
The strategy allows traders to select from three trading modes:
Long Only – Only takes long trades when bullish pivot breakouts occur.
Short Only – Only takes short trades when bearish pivot breakouts occur.
Long & Short – Trades in both directions based on pivot breakouts.
Trade entry signals are triggered when price breaks through a confirmed pivot level:
Long Entry:
A bullish pivot level is formed.
Price breaks above the bullish pivot level.
The strategy enters a long position.
Short Entry:
A bearish pivot level is formed.
Price breaks below the bearish pivot level.
The strategy enters a short position.
The strategy includes an optional mode to reverse long and short conditions, allowing traders to experiment with contrarian entries.
3. Exit Conditions Using ATR-Based Risk Management
This strategy uses the Average True Range (ATR) to calculate dynamic stop-loss and take-profit levels:
Stop-Loss (SL): Placed 1 ATR below entry for long trades and 1 ATR above entry for short trades.
Take-Profit (TP): Set using a Risk-Reward Ratio (RR) multiplier (default = 6x ATR).
When a trade is opened:
The entry price is recorded.
ATR is calculated at the time of entry to determine stop-loss and take-profit levels.
Trades exit automatically when either SL or TP is reached.
If reverse conditions mode is enabled, stop-loss and take-profit placements are flipped.
Visualization & Dynamic Support/Resistance Levels
1. Pivot Boxes for Market Structure
Each pivot is marked with a colored box:
Green boxes indicate bullish demand zones.
Red boxes indicate bearish supply zones.
These boxes remain on the chart to act as dynamic support and resistance levels, helping traders identify key price reaction zones.
2. Horizontal Entry, Stop-Loss, and Take-Profit Lines
When a trade is active, the strategy plots:
White line → Entry price.
Red line → Stop-loss level.
Green line → Take-profit level.
Labels display the exact entry, SL, and TP values, updating dynamically as price moves.
Customization Options
This strategy offers multiple adjustable settings to optimize performance for different market conditions:
Trade Mode Selection → Choose between Long Only, Short Only, or Long & Short.
Pivot Length → Defines the number of required Rally & Drop candles for a pivot.
ATR Exit Multiplier → Adjusts stop-loss distance based on ATR.
Risk-Reward Ratio (RR) → Modifies take-profit level relative to risk.
Historical Lookback → Limits how far back pivot zones are displayed.
Color Settings → Customize pivot box colors for bullish and bearish setups.
Considerations & Limitations
Pivot Breakouts Do Not Guarantee Reversals. Some pivot breaks may lead to continuation moves instead of trend reversals.
Not Optimized for Low Volatility Conditions. This strategy works best in trending markets with strong momentum.
ATR-Based Stop-Loss & Take-Profit May Require Optimization. Different assets may require different ATR multipliers and RR settings.
Market Noise May Still Influence Pivots. While this method filters some noise, fake breakouts can still occur.
Conclusion
The Rally Base Drop SND Pivots Strategy is a non-repainting supply and demand system that combines:
Pivot-based market structure analysis (using Rally, Base, and Drop candles).
Breakout-based trade entries at confirmed SND levels.
ATR-based dynamic risk management for stop-loss and take-profit calculation.
This strategy helps traders:
Identify high-probability supply and demand levels.
Trade based on structured market pivots.
Use a systematic approach to price action analysis.
Automatically manage risk with ATR-based exits.
The strict pivot detection rules and built-in breakout validation make this strategy ideal for traders looking to:
Trade based on market structure.
Use defined support & resistance levels.
Reduce noise compared to traditional fractals.
Implement a structured supply & demand trading model.
This strategy is fully customizable, allowing traders to adjust parameters to fit their market and trading style.
Full credit for the original concept and indicator goes to LuxAlgo.

Liquidity Sweep Filter Strategy [AlgoAlpha X PineIndicators]This strategy is based on the Liquidity Sweep Filter developed by AlgoAlpha. Full credit for the concept and original indicator goes to AlgoAlpha.
The Liquidity Sweep Filter Strategy is a non-repainting trading system designed to identify liquidity sweeps, trend shifts, and high-impact price levels. It incorporates volume-based liquidation analysis, trend confirmation, and dynamic support/resistance detection to optimize trade entries and exits.
This strategy helps traders:
Detect liquidity sweeps where major market participants trigger stop losses and liquidations.
Identify trend shifts using a volatility-based moving average system.
Analyze volume distribution with a built-in volume profile visualization.
Filter noise by differentiating between major and minor liquidity sweeps.
How the Liquidity Sweep Filter Strategy Works
1. Trend Detection Using Volatility-Based Filtering
The strategy applies a volatility-adjusted moving average system to determine trend direction:
A central trend line is calculated using an EMA smoothed over a user-defined length.
Upper and lower deviation bands are created based on the average price deviation over multiple periods.
If price closes above the upper band, the strategy signals an uptrend.
If price closes below the lower band, the strategy signals a downtrend.
This approach ensures that trend shifts are confirmed only when price significantly moves beyond normal market fluctuations.
2. Liquidity Sweep Detection
Liquidity sweeps occur when price temporarily breaks key levels, triggering stop-loss liquidations or margin call events. The strategy tracks swing highs and lows, marking potential liquidity grabs:
Bearish Liquidity Sweeps – Price breaks a recent high, then reverses downward.
Bullish Liquidity Sweeps – Price breaks a recent low, then reverses upward.
Volume Integration – The strategy analyzes trading volume at each sweep to differentiate between major and minor sweeps.
Key levels where liquidity sweeps occur are plotted as color-coded horizontal lines:
Red lines indicate bearish liquidity sweeps.
Green lines indicate bullish liquidity sweeps.
Labels are displayed at each sweep, showing the volume of liquidated positions at that level.
3. Volume Profile Analysis
The strategy includes an optional volume profile visualization, displaying how trading volume is distributed across different price levels.
Features of the volume profile:
Point of Control (POC) – The price level with the highest traded volume is marked as a key area of interest.
Bounding Box – The profile is enclosed within a transparent box, helping traders visualize the price range of high trading activity.
Customizable Resolution & Scale – Traders can adjust the granularity of the profile to match their preferred time frame.
The volume profile helps identify zones of strong support and resistance, making it easier to anticipate price reactions at key levels.
Trade Entry & Exit Conditions
The strategy allows traders to configure trade direction:
Long Only – Only takes long trades.
Short Only – Only takes short trades.
Long & Short – Trades in both directions.
Entry Conditions
Long Entry:
A bullish trend shift is confirmed.
A bullish liquidity sweep occurs (price sweeps below a key level and reverses).
The trade direction setting allows long trades.
Short Entry:
A bearish trend shift is confirmed.
A bearish liquidity sweep occurs (price sweeps above a key level and reverses).
The trade direction setting allows short trades.
Exit Conditions
Closing a Long Position:
A bearish trend shift occurs.
The position is liquidated at a predefined liquidity sweep level.
Closing a Short Position:
A bullish trend shift occurs.
The position is liquidated at a predefined liquidity sweep level.
Customization Options
The strategy offers multiple adjustable settings:
Trade Mode: Choose between Long Only, Short Only, or Long & Short.
Trend Calculation Length & Multiplier: Adjust how trend signals are calculated.
Liquidity Sweep Sensitivity: Customize how aggressively the strategy identifies sweeps.
Volume Profile Display: Enable or disable the volume profile visualization.
Bounding Box & Scaling: Control the size and position of the volume profile.
Color Customization: Adjust colors for bullish and bearish signals.
Considerations & Limitations
Liquidity sweeps do not always result in reversals. Some price sweeps may continue in the same direction.
Works best in volatile markets. In low-volatility environments, liquidity sweeps may be less reliable.
Trend confirmation adds a slight delay. The strategy ensures valid signals, but this may result in slightly later entries.
Large volume imbalances may distort the volume profile. Adjusting the scale settings can help improve visualization.
Conclusion
The Liquidity Sweep Filter Strategy is a volume-integrated trading system that combines liquidity sweeps, trend analysis, and volume profile data to optimize trade execution.
By identifying key price levels where liquidations occur, this strategy provides valuable insight into market behavior, helping traders make better-informed trading decisions.
Key use cases for this strategy:
Liquidity-Based Trading – Capturing moves triggered by stop hunts and liquidations.
Volume Analysis – Using volume profile data to confirm high-activity price zones.
Trend Following – Entering trades based on confirmed trend shifts.
Support & Resistance Trading – Using liquidity sweep levels as dynamic price zones.
This strategy is fully customizable, allowing traders to adapt it to different market conditions, timeframes, and risk preferences.
Full credit for the original concept and indicator goes to AlgoAlpha.

Trend Zone Moving Averages📈 Trend Zone Moving Averages
The Trend Zone Moving Averages indicator helps traders quickly identify market trends using the 50SMA, 100SMA, and 200SMA. With dynamic background colors, customizable settings, and real-time alerts, this tool provides a clear view of bullish, bearish, and extreme trend conditions.
🔹 Features:
Trend Zones with Dynamic Background Colors
Green → Bullish Trend (50SMA > 100SMA > 200SMA, price above 50SMA)
Red → Bearish Trend (50SMA < 100SMA < 200SMA, price below 50SMA)
Yellow → Neutral Trend (Mixed signals)
Dark Green → Extreme Bullish (Price above all three SMAs)
Dark Red → Extreme Bearish (Price below all three SMAs)
Customizable Moving Averages
Toggle 50SMA, 100SMA, and 200SMA on/off from the settings.
Perfect for traders who prefer a cleaner chart.
Real-Time Trend Alerts
Get instant notifications when the trend changes:
🟢 Bullish Zone Alert – When price enters a bullish trend.
🔴 Bearish Zone Alert – When price enters a bearish trend.
🟡 Neutral Zone Alert – When trend shifts to neutral.
🌟 Extreme Bullish Alert – When price moves above all SMAs.
⚠️ Extreme Bearish Alert – When price drops below all SMAs.
✅ Perfect for Any Market
Works on stocks, forex, crypto, and commodities.
Adaptable for day traders, swing traders, and investors.
⚙️ How to Use: Trend Zone Moving Averages Strategy
This strategy helps traders identify and trade with the trend using the Trend Zone Moving Averages indicator. It works across stocks, forex, crypto, and commodities.
🟢 Bullish Trend Strategy (Green Background)
Objective: Look for buying opportunities when the market is in an uptrend.
Entry Conditions:
✅ Background is Green (Bullish Zone).
✅ Price is above the 50SMA (confirming strength).
✅ Price pulls back to the 50SMA and bounces OR breaks above a key resistance level.
Stop Loss:
🔹 Place below the most recent swing low or just under the 50SMA.
Take Profit:
🔹 First target at the next resistance level or recent swing high.
🔹 Second target if price continues higher—trail stops to lock in profits.
🔴 Bearish Trend Strategy (Red Background)
Objective: Look for shorting opportunities when the market is in a downtrend.
Entry Conditions:
✅ Background is Red (Bearish Zone).
✅ Price is below the 50SMA (confirming weakness).
✅ Price pulls back to the 50SMA and rejects OR breaks below a key support level.
Stop Loss:
🔹 Place above the most recent swing high or just above the 50SMA.
Take Profit:
🔹 First target at the next support level or recent swing low.
🔹 Second target if price keeps falling—trail stops to secure profits.
🌟 Extreme Trend Strategy (Dark Green / Dark Red Background)
Objective: Trade with momentum when the market is in a strong trend.
Entry Conditions:
✅ Dark Green Background → Extreme Bullish: Price is above all three SMAs (strong uptrend).
✅ Dark Red Background → Extreme Bearish: Price is below all three SMAs (strong downtrend).
Trade Execution:
🔹 For longs (Dark Green): Look for breakout entries above resistance or pullbacks to the 50SMA.
🔹 For shorts (Dark Red): Look for breakdown entries below support or rejections at the 50SMA.
Risk Management:
🔹 Use tighter stop losses and trail profits aggressively to maximize gains.
🟡 Neutral Trend Strategy (Yellow Background)
Objective: Avoid trading or wait for a breakout.
What to Do:
🔹 Avoid trading in this zone—price is indecisive.
🔹 Wait for confirmation (background turns green/red) before taking a trade.
🔹 Use alerts to notify you when the trend resumes.
📌 Final Tips
Use this strategy with price action for extra confirmation.
Combine with support/resistance levels to improve accuracy.
Set alerts for trend changes so you never miss an opportunity.
Enjoy!

GRID EXTENSIONGRID EXTENSION
Overview
The GRID EXTENSION is a simple grid-based indicator for TradingView, built with Pine Script v6. It plots horizontal price levels starting from a user-defined anchor price, with spacing set by a tick increment. Use it to identify key support, resistance, or price zones on charts for Crypto, Forex, or Futures.
Key Features
Custom Grid Levels: Plot up to 22 levels (e.g., 0, 0.25, 1.25, -2.50) with options to show/hide, set values, and choose colors.
Market-Specific Tick Increments: Select your asset type (Crypto, Forex, Futures) and choose from a range of tick increments tailored for each market:
Crypto: 1 to 5000 ticks (e.g., 100 ticks = $0.001 on ADA/USD, 5000 ticks = $50 on BTC/USD).
Forex: 5 to 5000 ticks (e.g., 100 ticks = 1 pip on EUR/USD, 5000 ticks = 50 pips).
Futures: 1 to 2500 ticks (e.g., 25 ticks = 6.25 points on E-mini S&P 500, $312.50 per contract).
Visual Options:
Extend lines to the right.
Show price and level labels (as values or percentages).
Place labels on the left or right.
Adjust background transparency for filled areas between levels.
How to Use
Set Asset Type: Choose "Crypto," "Forex," or "Futures" to match your chart.
Set Anchor Price: Enter a starting price for the grid.
Pick Tick Increment: Select a tick increment from the dropdown, following the guidance for your asset type (see Key Features).
Customize Levels: Turn levels on/off, set values, and pick colors.
Add to Chart: Apply the indicator to see the grid on your chart.
Tips
Use levels to mark support/resistance zones for entries or exits.
Extend lines to project future price zones.
Choose smaller increments (e.g., 5 ticks) for scalping, or larger ones (e.g., 1000 ticks) for swing trading.
Combine with indicators like moving averages for better signals.
Settings
Asset Type: Select "Crypto," "Forex," or "Futures" (default: "Crypto").
Anchor Price: Starting price for the grid (default: 0.0).
Tick Increment: Space between levels (options: 1, 5, 10, 25, 50, 100, 250, 500, 1000, 2500, 5000). Choose based on asset type.
Extend Right: Extend lines to the right (default: true).
Show Prices: Show price labels (default: true).
Show Levels: Show level values or percentages (default: true).
Format: Display levels as "Values" or "Percent" (default: "Values").
Labels Position: Place labels on "Left" or "Right" (default: "Left").
Background Transparency: Set transparency for filled areas (default: 100, range 0-100).
Level Options: Enable/disable levels, set values, and choose colors.
Notes
Set the anchor price to a key level (like a recent high or low) for best results.
Check the tick increment tooltip to ensure the spacing suits your market type.
Works on any chart, best for clear price trends or ranges.
Acknowledgments
Made with Pine Script v6 for TradingView. This is v1.0—feedback welcome for future updates!

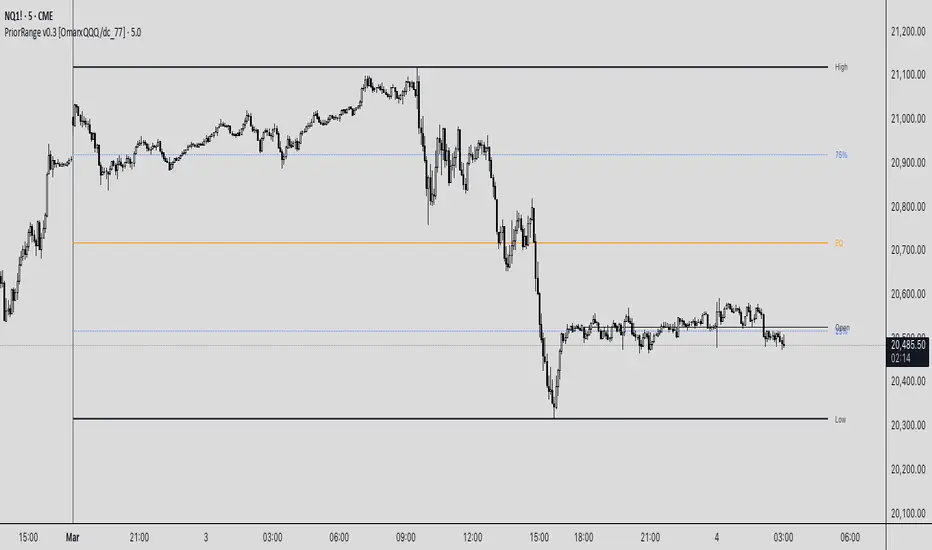
PriorRange v0.3 [OmarxQQQ/dc_77]PriorRangeLevels is a versatile indicator that plots key price levels based on prior period ranges across multiple timeframes. This tool helps traders identify potential support, resistance, and breakout zones by displaying the High, Low, 75%, 50% (EQ), and 25% levels from the previous period.
Key Features:
- Multi-timeframe analysis from 1-minute to Monthly charts
- Time zone flexibility with options for major global markets (NYC, London, Tokyo, etc.)
- Customizable display for each level (High, Low, 75%, EQ, 25%, Open)
- Clean, organized settings interface with grouped options
- Anchor line marking the start of prior periods
- Current period open price reference
How It Works:
The indicator detects new periods based on your selected timeframe and calculates the range of the previous period. It then plots horizontal lines at the High, Low, and three internal levels (75%, 50%, 25%) extending forward by your specified number of bars. These levels serve as potential support/resistance zones and decision points for your trading strategy.
Trading Applications:
- Use High/Low levels as potential breakout targets or reversal zones
- Monitor price reaction to the EQ (50%) level to gauge trend strength
- Identify intraday support/resistance based on previous period ranges
- Plan entries and exits around established market structure
Each component can be individually customized with different line styles, colors, and widths to match your chart preferences and analytical needs.
Originally created by @dc_77 with enhanced organization, multi-timeframe capabilities, and improved user interface. As Requested by many people.
populi a populo pro populo
GLGT
Order Blocks-[B.Balaei]Order Blocks -
**Description:**
The Order Blocks - indicator is a powerful tool designed to identify and visualize Order Blocks on your chart. Order Blocks are key levels where significant buying or selling activity has occurred, often acting as support or resistance zones. This indicator supports multiple timeframes (MTF), allowing you to analyze Order Blocks from higher timeframes directly on your current chart.
**Key Features:**
1. **Multi-Timeframe Support**: Choose any timeframe (e.g., Daily, Weekly) to display Order Blocks from higher timeframes.
2. **Customizable Sensitivity**: Adjust the sensitivity to detect more or fewer Order Blocks based on market conditions.
3. **Bullish & Bearish Order Blocks**: Clearly distinguishes between bullish (green) and bearish (red) Order Blocks.
4. **Alerts**: Get notified when price enters a Bullish or Bearish Order Block zone.
5. **Customizable Colors**: Personalize the appearance of Order Blocks to match your chart style.
**How to Use:**
1. Add the indicator to your chart.
2. Select your desired timeframe from the "Multi-Timeframe" settings.
3. Adjust the sensitivity and colors as needed.
4. Watch for Order Blocks to form and use them as potential support/resistance levels.
**Ideal For:**
- Swing traders and position traders looking for key levels.
- Traders who use multi-timeframe analysis.
- Anyone interested in understanding market structure through Order Blocks.
**Note:**
This indicator is for educational and informational purposes only. Always conduct your own analysis before making trading decisions.
**Enjoy trading with Order Blocks - !**

Supertrend and Fast and Slow EMA StrategyThis strategy combines Exponential Moving Averages (EMAs) and Average True Range (ATR) to create a simple, yet effective, trend-following approach. The strategy filters out fake or sideways signals by incorporating the ATR as a volatility filter, ensuring that trades are only taken during trending conditions. The key idea is to buy when the short-term trend (Fast EMA) aligns with the long-term trend (Slow EMA), and to avoid trades during low volatility periods.
How It Works:
EMA Crossover:
1). Buy Signal: When the Fast EMA (shorter-term, e.g., 20-period) crosses above the Slow EMA (longer-term, e.g., 50-period), this indicates a potential uptrend.
2). Sell Signal: When the Fast EMA crosses below the Slow EMA, this indicates a potential downtrend.
ATR Filter:
1). The ATR (Average True Range) is used to measure market volatility.
2). Trending Market: If the ATR is above a certain threshold, it indicates high volatility and a trending market. Only when ATR is above the threshold will the strategy generate buy/sell signals.
3). Sideways Market: If ATR is low (sideways or choppy market), the strategy will suppress signals to avoid entering during non-trending conditions.
When to Buy:
1). Condition 1: The Fast EMA crosses above the Slow EMA.
2). Condition 2: The ATR is above the defined threshold, indicating that the market is trending (not sideways or choppy).
When to Sell:
1). Condition 1: The Fast EMA crosses below the Slow EMA.
2). Condition 2: The ATR is above the defined threshold, confirming that the market is in a downtrend.
When Not to Enter the Trade:
1). Sideways Market: If the ATR is below the threshold, signaling low volatility and sideways or choppy market conditions, the strategy will not trigger any buy or sell signals.
2). False Crossovers: In low volatility conditions, price action tends to be noisy, which could lead to false signals. Therefore, avoiding trades during these periods reduces the risk of false breakouts.
Additional Factors to Consider Adding:
=> RSI (Relative Strength Index): Adding an RSI filter can help confirm overbought or oversold conditions to avoid buying into overextended moves or selling too low.
1). RSI Buy Filter: Only take buy signals when RSI is below 70 (avoiding overbought conditions).
2). RSI Sell Filter: Only take sell signals when RSI is above 30 (avoiding oversold conditions).
=> MACD (Moving Average Convergence Divergence): Using MACD can help validate the strength of the trend.
1). Buy when the MACD histogram is above the zero line and the Fast EMA crosses above the Slow EMA.
2). Sell when the MACD histogram is below the zero line and the Fast EMA crosses below the Slow EMA.
=> Support/Resistance Levels: Adding support and resistance levels can help you understand market structure and decide whether to enter or exit a trade.
1). Buy when price breaks above a significant resistance level (after a valid buy signal).
2). Sell when price breaks below a major support level (after a valid sell signal).
=> Volume: Consider adding a volume filter to ensure that buy/sell signals are supported by strong market participation. You could only take signals if the volume is above the moving average of volume over a certain period.
=> Trailing Stop Loss: Instead of a fixed stop loss, use a trailing stop based on a percentage or ATR to lock in profits as the trade moves in your favor.
=> Exit Signals: Besides the EMA crossover, consider adding Take Profit or Stop Loss levels, or even using a secondary indicator like RSI to signal an overbought/oversold condition and exit the trade.
Example Usage:
=> Buy Example:
1). Fast EMA (20-period) crosses above the Slow EMA (50-period).
2). The ATR is above the threshold, confirming that the market is trending.
3). Optionally, if RSI is below 70, the buy signal is further confirmed as not being overbought.
=> Sell Example:
1). Fast EMA (20-period) crosses below the Slow EMA (50-period).
2). The ATR is above the threshold, confirming that the market is trending.
3). Optionally, if RSI is above 30, the sell signal is further confirmed as not being oversold.
Conclusion:
This strategy helps to identify trending markets and filters out sideways or choppy market conditions. By using Fast and Slow EMAs combined with the ATR volatility filter, it provides a reliable approach to catching trending moves while avoiding false signals during low-volatility, sideways markets.

NFP High/Low Levels PlusNFP High/Low Levels Plus
Description:
This indicator stores the 12 most recent NFP (Non-Farm-Payroll) days and their values.
Values are captured from 0830 (NFP Release) until close of market
The High and Low values for each NFP month are drawn on the chart with horizontal lines.
- Labels indicating the month's high or low line are placed after the line
- Optionally the high/low price can be displayed additionally
Support and Resistance boxes can be drawn at the closest NFP level above and below the
current price.
- Boxes will automatically update as prices cross the NFP value
Macro Indicator
- This option displays a small table in the top right corner that says "Up" or " Down"
- The Macro Indicator can be used to judge the potential direction for the current month
- Macro direction is calculated by the following:
- UP: If two consecutive days both open and close above the most recent NFP High level
- DOWN: If two consecutive days both open and close below the most recent NFP Low level
Micro Indicator
- This option displays a small table in the top right corner that says "Up" or " Down"
- The Micro Indicator can be used to judge the potential direction for low timeframes 1H or
lower
- Micro direction is calculated by the following:
- UP: If two consecutive 10m candles close above the 20EMA
- DOWN: If two consecutive 10m candles close below the 20EMA
NFP Session Bars
- This feature draws an arrow at the bottom of the chart for each candle that falls within the
NFP session day
- This is useful for identifying NFP Days
Support / Resistance Table
- This displays a table bottom center showing the nearest high and low NFP line level
What is an NFP Day and why is it useful to add to my chart?
- NFP Days are one of the most important data releases monthly
- NFP (Non-Farm-Payroll) is the official release of 80% of the US workforce employed in
manufacturing, construction, and goods
- It does not include those who work on farms, private households, non-profit and
government workers
- Historically these high/low levels for the day create strong support and resistance levels
- Having them displayed on the chart can help identify potential strong levels and pivot points
Full Indicator with all options enabled and identified
Easily update NFP Release Days in the indicator settings
Modify various options: Show/Hide lines, labels, directional indicator tables, values tables
Adjust line width, offsets, colors, font sizes, box widths
Enable individual Directional Indicators and modify colors
Example of full indicator enabled
You can find a list of the NFP Release Schedule on the official US Bureau of Labor Statistics website. This is useful for updating the indicator settings with the correct dates

Heatmap Suite [PhenLabs]📊 Heatmap Suite
Version: PineScript™ v6
📌 Description
The Heatmap Suite is an advanced technical analysis tool that combines multiple density calculation methods with dynamic visualization to identify significant price levels and trading activity zones. It features a sophisticated analysis system that processes price and volume data through various kernel methods, providing traders with insights into market structure, support/resistance zones, and potential price reaction areas.
🚀 Points of Innovation:
Multi-method density calculation incorporating three distinct approaches
Adaptive visualization system with dynamic color gradients
Real-time dashboard with key market metrics
Significant level detection with automatic threshold adjustment
🚨 Important🚨
🔸Comprehensive tooltips included in the PhenLabs dashboard for in depth guidance
🔧 Core Components
Density Analysis: Multiple calculation methods for price distribution assessment
Heat Mapping: Dynamic visualization of price congestion zones
Level Detection: Automatic identification of significant price levels
Dashboard System: Real-time market metrics and analysis
🔥 Key Features
The indicator provides comprehensive analysis through:
Kernel Density: Traditional balanced view of price distribution
Exponential Kernel: Time-weighted analysis emphasizing recent price action
Volume-Weighted: Focus on high-volume price areas
Significant Levels: Automatic detection of important price zones
Heat Distribution: Color-coded visualization of price congestion
🎨 Visualization
Heat Zones: Shows intensity of price activity
Significant Lines: Key level indicators
Color Gradients: Indicates density strength
Dashboard Display: Real-time metrics
Dynamic Opacity: Reflects density intensity
📖 Usage Guidelines
The indicator offers several customization options:
Basic Settings:
Calculation Method: Choose between three density calculation approaches
Lookback Period: Analysis timeframe adjustment
Zone Count: Price range division granularity
Heat Sensitivity: Contrast adjustment for visualization
🎛️ Visual Settings:
Dashboard Size: Text size customization
Position: Dashboard placement options
Color Scheme: Heat map gradient visualization
Level Display: Significant price zone indicators
✅ Best Use Cases:
Identify strong support/resistance zones through high-density areas
Spot potential price reversal zones at significant levels
Analyze price congestion patterns
Monitor real-time changes in market structure
⚠️ Limitations
Requires sufficient historical data
Computational intensity increases with longer lookback periods
Heat sensitivity needs adjustment based on market conditions
Dashboard placement may need adjustment based on price action
💡 What Makes This Unique
Multi-method Analysis: Three distinct calculation approaches
Adaptive Visualization: Dynamic color gradient system
Real-time Metrics: Comprehensive dashboard display
Automatic Level Detection: Significant price zone identification
Memory-efficient Design: Optimized calculation methods
🔬 How It Works
The indicator processes market data through four main components:
1. Density Calculation:
Processes price and volume data
Applies selected kernel method
Generates density distribution
2. Heat Mapping:
Converts density values to color gradients
Updates visualization in real-time
Displays price congestion zones
3. Level Detection:
Identifies significant price levels
Applies threshold filtering
Marks important zones
4. Dashboard Updates:
Calculates real-time metrics
Updates display components
Provides market context
💡Note:
The indicator performs best with adequate historical data and proper sensitivity settings. Its sophisticated density analysis provides valuable insights into market structure beyond traditional support/resistance indicators.

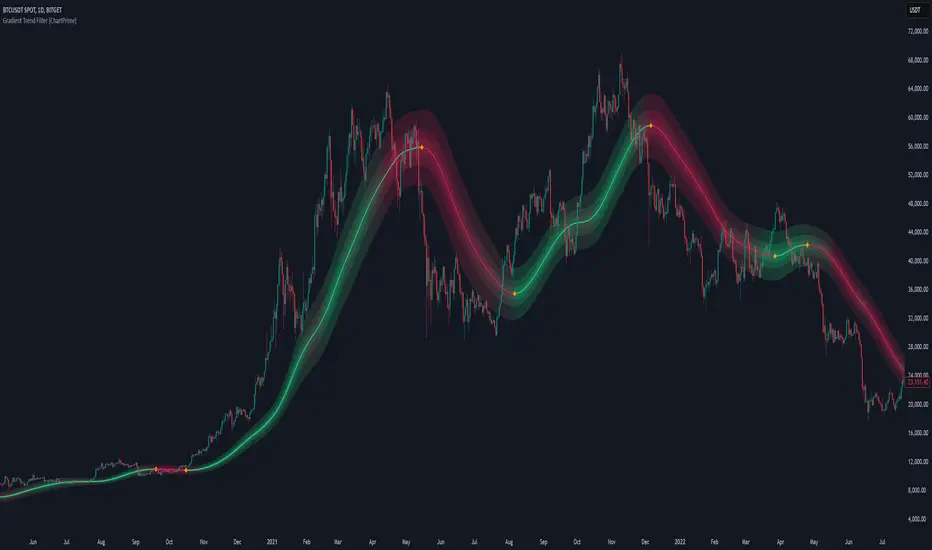
Gradient Trend Filter [ChartPrime]The Gradient Trend Filter is a dynamic trend analysis tool that combines a noise-filtered trend detection system with a color-gradient cloud. It provides traders with a visual representation of trend strength, momentum shifts, and potential reversals.
⯁ KEY FEATURES
Trend Noise Filtering
Uses an advanced smoothing function to filter market noise and produce a more reliable trend representation.
// Noise filter function
noise_filter(src, length) =>
alpha = 2 / (length + 1)
nf_1 = 0.0
nf_2 = 0.0
nf_3 = 0.0
nf_1 := (alpha * src) + ((1 - alpha) * nz(nf_1 ))
nf_2 := (alpha * nf_1) + ((1 - alpha) * nz(nf_2 ))
nf_3 := (alpha * nf_2) + ((1 - alpha) * nz(nf_3 ))
nf_3 // Final output with three-stage smoothing
Color-Based Trend Visualization
The mid-line changes color based on trend direction—green for uptrends and red for downtrends—making it easy to identify trends at a glance.
Orange diamond markers appear when a trend shift is confirmed, providing actionable signals for traders.
Gradient Color Trend Cloud
A cloud around the base trend line that dynamically changes color, often signaling trend shifts ahead of the main trend line.
When in a downtrend, if the cloud starts turning green, it suggests weakening bearish momentum or an upcoming bullish reversal. Conversely, when in an uptrend, a red cloud indicates potential trend weakening or a bearish reversal.
Multi-Layered Trend Bands
The cloud consists of multiple bands, offering a range of support and resistance zones that traders can use for confluence in decision-making.
⯁ HOW TO USE
Identify Trend Strength & Reversals
Use the mid-line and cloud color changes to assess the strength of a trend and spot early signs of reversals.
Monitor Momentum Shifts
Watch for gradient cloud color shifts before the trend line changes color, as this can indicate early weakening or strengthening of momentum.
Act on Trend Shift Markers
Use the orange diamonds as confirmation of trend shifts and potential trade entry or exit points.
Utilize Cloud Bands as Support/Resistance
The outer bands of the cloud act as dynamic support and resistance, helping traders refine their stop-loss and take-profit placements.
⯁ CONCLUSION
The Gradient Trend Filter is an advanced trend detection tool designed for traders looking to anticipate trend shifts with greater precision. By integrating a noise-filtered trend line with a gradient-based trend cloud, this indicator enhances traders' ability to navigate market trends effectively.
Intrabar Volume Distribution [BigBeluga]Intrabar Volume Distribution is an advanced volume and order flow indicator that visualizes the buy and sell volume distribution within each candlestick.
🔔 Before Use:
Turn off the background color of your candles for clear visibility.
Overlay the indicator on the top layout to ensure accurate alignment with the price chart.
🔵 Key Features:
Inside Bar Volume Visualization:
Each candlestick is divided into two columns:
Left column displays the sell % volume amount.
Right column displays the buy % volume amount.
Provides a clear representation of buyer-seller activity within individual bars.
Percentage Volume Labels:
Labels above each bar show the percentage share of sell and buy volume relative to the total (100%).
Quickly assess market sentiment and volume imbalances.
Point of Control (POC) Levels:
Orange dashed lines mark the POC inside each bar, indicating the price level with the highest traded volume.
Helps identify key liquidity zones within individual candlesticks.
Multi-Timeframe Volume Analysis:
The indicator automatically uses a timeframe 20-30 times lower than the current one to gather detailed volume data.
For each higher timeframe candle, it collects 20-30 bars of lower timeframe data for precise volume mapping.
Each bar is divided into 100 volume bins to capture detailed volume distribution across the price range.
Bins are filled based on the aggregated volume from the lower timeframe data.
Lookback Period:
Allows traders to select how many bars to display with delta and volume information.
The beginning of the selected lookback period is marked with a gray line and label for quick reference.
Indicator displays up to 80 bars back
🔵 Usage:
Order Flow Analysis: Monitor buy/sell volume distribution to spot potential reversals or continuations.
Liquidity Identification: Use POC levels to locate areas of strong market interest and potential support/resistance.
Volume Imbalance Detection: Pay attention to percentage labels for quick recognition of buyer or seller dominance.
Scalping & Intraday Trading: Ideal for traders seeking real-time insight into order flow and volume behavior.
Historical Analysis: Adjust the lookback period to analyze past price action and volume activity.
Intrabar Volume Distribution is a powerful tool for traders aiming to gain deeper insight into market sentiment through detailed volume analysis, allowing for more informed trading decisions based on real-time order flow dynamics.

Volume Profile With HVN & LVN detectorVolume Profile Indicator
Based on the works of tradeforopp
Overview
The Volume Profile Indicator is a powerful technical analysis tool that visually represents the distribution of trading volume over price levels within a specified timeframe. It helps traders identify key support and resistance zones, high-volume trading areas, and low-volume rejection zones. The indicator includes customizable settings for Volume Point of Control (VPOC), High Volume Nodes (HVNs), and Low Volume Nodes (LVNs), making it a versatile tool for price action analysis and volume-based decision-making.
Key Features
🔹 Customizable Volume Profile
Adjustable number of rows to define the resolution of the volume profile.
Configurable timeframe aggregation for profile calculation (e.g., Daily, Weekly).
Selectable price resolution timeframe for precise profile construction.
Extendable volume profile for future sessions.
Fully customizable profile color and transparency settings.
🔹 Volume Point of Control (VPOC)
Displays the most traded price level within the selected timeframe.
Option to extend multiple VPOCs across the chart.
Adjustable VPOC line width and color customization.
Option to display VPOC labels when working with higher timeframe profiles.
🔹 High Volume Nodes (HVNs)
Identifies high-volume price levels where significant trading activity has occurred.
Configurable HVN strength to adjust detection sensitivity.
Two display modes:
Lines: Plots HVN levels as horizontal lines.
Areas: Highlights HVN regions with colored boxes.
Separate bullish and bearish HVN color settings.
🔹 Low Volume Nodes (LVNs)
Identifies low-volume price levels, which often act as rejection zones.
Configurable LVN strength to fine-tune detection.
Two display modes:
Lines: Marks LVN levels as horizontal lines.
Areas: Highlights LVN regions with shaded boxes.
Separate bullish and bearish LVN color settings.
🔹 Optimized for Performance
Efficient use of arrays for data storage and retrieval.
Global functions for HVN and LVN detection.
Uses security calls to access lower timeframe price and volume data.
Use Cases
✅ Identify Support & Resistance Levels
The indicator highlights key price levels where significant buying or selling interest exists.
✅ Detect Breakout & Reversal Zones
Low-volume areas (LVNs) often indicate price rejection zones, while high-volume areas (HVNs) suggest strong price acceptance zones.
✅ Improve Trade Entries & Exits
Traders can use the Volume Point of Control (VPOC) and volume clusters to refine entry and exit points.
✅ Enhance Price Action Strategies
By incorporating volume-based analysis, this indicator provides deeper market insights beyond traditional support/resistance and trendlines.
Customization & Settings
📌 Volume Profile Settings:
Rows: Defines the granularity of the volume profile.
Profile Timeframe: Specifies the aggregation period (e.g., Daily, Weekly).
Resolution Timeframe: Determines the price resolution for volume analysis.
Profile Extend %: Controls how much the profile extends into the next session.
📌 Volume Point of Control (VPOC):
Enable/Disable VPOC visualization.
Extend past VPOC levels to the right.
Display VPOC labels for higher timeframe profiles.
Adjustable VPOC line width and color.
📌 High Volume Nodes (HVNs):
Enable/Disable HVN detection.
Define HVN strength (volume threshold).
Choose between Line Mode or Area Mode.
Configure bullish and bearish HVN colors.
📌 Low Volume Nodes (LVNs):
Enable/Disable LVN detection.
Define LVN strength (volume threshold).
Choose between Line Mode or Area Mode.
Configure bullish and bearish LVN colors.

Cluster Reversal Zones📌 Cluster Reversal Zones – Smart Market Turning Point Detector
📌 Category : Public (Restricted/Closed-Source) Indicator
📌 Designed for : Traders looking for high-accuracy reversal zones based on price clustering & liquidity shifts.
🔍 Overview
The Cluster Reversal Zones Indicator is an advanced market reversal detection tool that helps traders identify key turning points using a combination of price clustering, order flow analysis, and liquidity tracking. Instead of relying on static support and resistance levels, this tool dynamically adjusts to live market conditions, ensuring traders get the most accurate reversal signals possible.
📊 Core Features:
✅ Real-Time Reversal Zone Mapping – Detects high-probability market turning points using price clustering & order flow imbalance.
✅ Liquidity-Based Support/Resistance Detection – Identifies strong rejection zones based on real-time liquidity shifts.
✅ Order Flow Sensitivity for Smart Filtering – Filters out weak reversals by detecting real market participation behind price movements.
✅ Momentum Divergence for Confirmation – Aligns reversal zones with momentum divergences to increase accuracy.
✅ Adaptive Risk Management System – Adjusts risk parameters dynamically based on volatility and trend state.
🔒 Justification for Mashup
The Cluster Reversal Zones Indicator contains custom-built methodologies that extend beyond traditional support/resistance indicators:
✔ Smart Price Clustering Algorithm: Instead of plotting fixed support/resistance lines, this system analyzes historical price clustering to detect active reversal areas.
✔ Order Flow Delta & Liquidity Shift Sensitivity: The tool tracks real-time order flow data, identifying price zones with the highest accumulation or distribution levels.
✔ Momentum-Based Reversal Validation: Unlike traditional indicators, this tool requires a momentum shift confirmation before validating a potential reversal.
✔ Adaptive Reversal Filtering Mechanism: Uses a combination of historical confluence detection + live market validation to improve accuracy.
🛠️ How to Use:
• Works well for reversal traders, scalpers, and swing traders seeking precise turning points.
• Best combined with VWAP, Market Profile, and Delta Volume indicators for confirmation.
• Suitable for Forex, Indices, Commodities, Crypto, and Stock markets.
🚨 Important Note:
For educational & analytical purposes only.

Adaptive Supply and Demand [EdgeTerminal]Adaptive Supply and Demand is a dynamic supply and demand indicator with a few unique twists. It considers volume pressure, volatility-based adjustments and multi-time frame momentum for confidence scoring (multi-step confirmation) to generate dynamic lines that adjust based on the market and also to generate dynamic support/resistance levels for the supply and demand lines.
The dynamic support and resistance lines shown gives you a better situational awareness of the current state of the market and add more context to why the market is moving into a certain direction.
> Trading Scenarios
When the confidence score is over 80%, strong volume pressure in trend direction (up or down), volatility is low and momentum is aligned across timeframes, there is an indication of a strong upward or downward trend.
When the supply and demand line crossover, the confidence score is over 75% and the volume pressure is shifting, this can be an indicator of trend reversal. Use tight initial stops, scale into position as trend develops, monitor the volume pressure for continuation and wait for confidence confirmation.
When the confiance score is below 60%, the volume pressure is choppy, volatility is high, you want to avoid trading or reduce position size, wait for confidence improvements, use support and resistance for entries/exits and use tighter stops due to market conditions. This is an indication of a ranging market.
Another scenario is when there is a sudden volume pressure increase, and a raising confidence score, the volatility is expanding and the bar momentum is aligning the volatility direction. This can indicate a breakout scenario.
> How it Works
1. Volume Pressure Analysis
Volume Pressure Analysis is a key component that measures the true buying and selling force in the market. Here's a detailed breakdown. The idea is to standardize volume to prevent large spikes from skewing results.
The indicator employs an adaptive volume normalization technique to detect genuine buying and selling pressure.
It takes current volume and divides it by average volume.
If normVol > 1: Current volume is above average
If normVol < 1: Current volume is below average
An example if this would be If current volume is 1500 and average is 1000, normVol = 1.5 (50% above average)
Another component of the volume pressure analysis is the Price Change Calculation sub-module. The purpose of this is to measure price movement relative to recent average.
It works by subtracting the average price from the current price. If the value is positive, price is average and if negative, price is below average.
Finally, the volume pressure is calculated to combine volume and price for true pressure reading.
2. Savitzky-Golay Filtering
SG filtering implements advanced signal smoothing while preserving important trend features. It uses weighted moving average approximation, preserves higher moments of data and reduces noise while maintaining signal integrity.
This results in smoother signal lines, reduced false crossovers and better trend identification. Traditional moving averages tend to lag and smooth out important features. Additionally, simple moving averages can miss critical turning points and regular smoothing can delay signal generation.
SG filtering preserves higher moments such as peaks, valleys and trends, reduces noise while maintaining signal sharpness.
It works by creating a symmetric weighting scheme. This way center points get the highest weights while edge points get the lowest weight.
3. Parkinson's Volatility
Parkinson's Volatility is an advanced volatility measurement formula using high-low range data. It uses high-low range for volatility calculation, incorporates logarithmic returns and annualized the volatility measure.
This results in more accurate volatility measurement, better risk assessment and dynamic signal sensitivity.
4. Multi-timeframe Momentum
This combines signals from each module for each timeframe to calculate momentum across three timeframes. It also applies weighted importance to each timeframe and generates a composite momentum signal.
This results in a more comprehensive trend analysis, reduced timeframe bias and better trend confirmation.
> Indicator Settings
Short-term Period:
Lower values makes it more sensitive, meaning it will generate more signals. Higher values makes it less sensitive, resulting in fewer signals. We recommend a 5 to 15 range for day trading, and 10 to 20 for swing trading
Medium-term Period:
Lower values result in faster trend confirmation and higher values show slower and more reliable confirmation. We recommend a range of 15-25 for day trading and 20-30 for swing trading.
Long-term Period:
Lower values makes it more responsive to trend changes and higher values are better for major trend identification. We recommend a range of 40-60 for day trading and 50-100 for swing trading.
Volume Analysis Window:
Lower values result in more sensitivity to volume changes and higher values result in smoother volume analysis. The optimal range is 15-25 for most trading styles.
Confidence Threshold:
Lower values generate more signals but quality decreases. Higher values generate fewer signals but accuracy increases.The optimal range is 0.65-0.8 for most trading conditions.

Blackflag FTS (1H Trailing) + MSB-OB FibThis indicator combines a 1-hour trailing stop system with multi-timeframe Fibonacci retracement levels and ZigZag structure detection to assist traders in identifying trend direction and potential reversal zones.
Features:
✅ 1-Hour Trailing Stop: Uses an ATR-based trailing stop mechanism to track trend direction and dynamic support/resistance.
✅ Multi-Timeframe Approach: The trailing stop is calculated on the 1-hour timeframe, while the ZigZag and Fibonacci retracement levels are based on the 15-minute chart.
✅ ZigZag Structure Detection: Helps filter market swings and trend reversals dynamically.
✅ Fibonacci Levels (0.5 & 0.786): Key retracement levels to watch for price reactions.
✅ Alerts for Key Levels: Get notified when the price crosses important levels (1H trailing stop, Fib 0.5, Fib 0.786).
How It Works:
The trailing stop adapts dynamically based on ATR values and determines trend direction.
ZigZag detection filters out minor price movements to highlight major swing points.
Fibonacci levels are calculated based on ZigZag swings, helping traders spot potential reversal zones.
This tool is useful for trend-following traders, breakout traders, and Fibonacci-based strategies.
Let me know if you'd like any modifications! 🚀

Sma Indicator with Ratio (pr)SMA Indicator with Ratio (PR) is a technical analysis tool designed to provide insights into the relationship between multiple Simple Moving Averages (SMAs) across different time frames. This indicator combines three key SMAs: the 111-period SMA, 730-period SMA, and 1400-period SMA. Additionally, it introduces a ratio-based approach, where the 730-period SMA is multiplied by factors of 2, 3, 4, and 5, allowing users to analyze potential market trends and price movements in relation to different SMA levels.
What Does This Indicator Do?
The primary function of this indicator is to track the movement of prices in relation to several SMAs with varying periods. By visualizing these SMAs, users can quickly identify:
Short-term trends (111-period SMA)
Medium-term trends (730-period SMA)
Long-term trends (1400-period SMA)
Additionally, the multiplied versions of the 730-period SMA provide deeper insights into potential price reactions at different levels of market volatility.
How Does It Work?
The 111-period SMA tracks the shorter-term price trend and can be used for identifying quick market movements.
The 730-period SMA represents a longer-term trend, helping users gauge overall market sentiment and direction.
The 1400-period SMA acts as a very long-term trend line, giving users a broad perspective on the market’s movement.
The ratio-based SMAs (2x, 3x, 4x, 5x of the 730-period SMA) allow for an enhanced understanding of how the price reacts to higher or lower volatility levels. These ratios are useful for identifying key support and resistance zones in a dynamic market environment.
Why Use This Indicator?
This indicator is useful for traders and analysts who want to track the interaction of price with different moving averages, enabling them to make more informed decisions about potential trend reversals or continuations. The added ratio-based values enhance the ability to predict how the market might react at different levels.
How to Use It?
Trend Confirmation: Traders can use the indicator to confirm the direction of the market. If the price is above the 111, 730, or 1400-period SMA, it may indicate an uptrend, and if below, a downtrend.
Support/Resistance Levels: The multiplied versions of the 730-period SMA (2x, 3x, 4x, 5x) can be used as dynamic support or resistance levels. When the price approaches or crosses these levels, it might indicate a change in the trend.
Volatility Insights: By observing how the price behaves relative to these SMAs, traders can gauge market volatility. Higher multiples of the 730-period SMA can signal more volatile periods where price movements are more pronounced.

AMD Session Structure Levels# Market Structure & Manipulation Probability Indicator
## Overview
This advanced indicator is designed for traders who want a systematic approach to analyzing market structure, identifying manipulation, and assessing probability-based trade setups. It incorporates four core components:
### 1. Session Price Action Analysis
- Tracks **OHLC (Open, High, Low, Close)** within defined sessions.
- Implements a **dual tracking system**:
- **Official session levels** (fixed from the session open to close).
- **Real-time max/min tracking** to differentiate between temporary spikes and real price acceptance.
### 2. Market Manipulation Detection
- Identifies **manipulative price action** using the relationship between the open and close:
- If **price closes below open** → assumes **upward manipulation**, followed by **downward distribution**.
- If **price closes above open** → assumes **downward manipulation**, followed by **upward distribution**.
- Normalized using **ATR**, ensuring adaptability across different volatility conditions.
### 3. Probability Engine
- Tracks **historical wick ratios** to assess trend vs. reversal conditions.
- Calculates **conditional probabilities** for price moves.
- Uses a **special threshold system (0.45 and 0.03)** for reversal signals.
- Provides **real-time probability updates** to enhance trade decision-making.
### 4. Market Condition Classification
- Classifies market conditions using a **wick-to-body ratio**:
```pine
wick_to_body_ratio = open > close ? upper_wick / (high - low) : lower_wick / (high - low)
```
- **Low ratio (<0.25)** → Likely a **trend day**.
- **High ratio (>0.25)** → Likely a **range day**.
---
## Why This Indicator Stands Out
### ✅ Smarter Level Detection
- Uses **ATR-based dynamic levels** instead of static support/resistance.
- Differentiates **manipulation from distribution** for better decision-making.
- Updates probabilities **in real-time**.
### ✅ Memory-Efficient Design
- Implements **circular buffers** to maintain efficiency:
```pine
var float manipUp = array.new_float(lookbackPeriod, 0.0)
var float manipDown = array.new_float(lookbackPeriod, 0.0)
```
- Ensures **constant memory usage**, even over extended trading sessions.
### ✅ Advanced Probability Calculation
- Utilizes **conditional probabilities** instead of simple averages.
- Incorporates **market context** through wick analysis.
- Provides **actionable signals** via a probability table.
---
## Trading Strategy Guide
### **Best Entry Setups**
✅ Wait for **price to approach manipulation levels**.
✅ Confirm using the **probability table**.
✅ Check the **wick ratio for context**.
✅ Enter when **conditional probability aligns**.
### **Smart Exit Management**
✅ Use **distribution levels** as **profit targets**.
✅ Scale out **when probabilities shift**.
✅ Monitor **wick percentiles** for confirmation.
### **Risk Management**
✅ Size positions based on **probability readings**.
✅ Place stops at **manipulation levels**.
✅ Adjust position size based on **trend vs. range classification**.
---
## Configuration Tips
### **Session Settings**
```pine
sessionTime = input.session("0830-1500", "Session Hours")
weekDays = input.string("23456", "Active Days")
```
- Match these to your **primary trading session**.
- Adjust for different **market opens** if needed.
### **Analysis Parameters**
```pine
lookbackPeriod = input.int(50, "Lookback Period")
low_threshold = input.float(0.25, "Trend/Range Threshold")
```
- **50 periods** is a good starting point but can be optimized per instrument.
- The **0.25 threshold** is ideal for most markets but may need adjustments.
---
## Market Structure Breakdown
### **Trend/Continuation Days**
- **Characteristics:**
✅ Small **opposing wicks** (minimal counter-pressure).
✅ Clean, **directional price movement**.
- **Bullish Trend Day Example:**
✅ Small **lower wicks** (minimal downward pressure).
✅ Strong **closes near the highs** → **Buyers in control**.
- **Bearish Trend Day Example:**
✅ Small **upper wicks** (minimal upward pressure).
✅ Strong **closes near the lows** → **Sellers in control**.
### **Reversal Days**
- **Characteristics:**
✅ **Large opposing wicks** → Failed momentum in the initial direction.
- **Bullish Reversal Example:**
✅ **Large upper wick early**.
✅ **Strong close from the lows** → **Sellers failed to maintain control**.
- **Bearish Reversal Example:**
✅ **Large lower wick early**.
✅ **Weak close from the highs** → **Buyers failed to maintain control**.
---
## Summary
This indicator systematically quantifies market structure by measuring **manipulation, distribution, and probability-driven trade setups**. Unlike traditional indicators, it adapts dynamically using **ATR, historical probabilities, and real-time tracking** to offer a structured, data-driven approach to trading.
🚀 **Use this tool to enhance your decision-making and gain an objective edge in the market!**

Price Imbalance as Consecutive Levels of AveragesOverview
The Price Imbalance as Consecutive Levels of Averages indicator is an advanced technical analysis tool designed to identify and visualize price imbalances in financial markets. Unlike traditional moving average (MA) indicators that update continuously with each new price bar, this indicator employs moving averages calculated over consecutive, non-overlapping historical windows. This unique approach leverages comparative historical data to provide deeper insights into trend strength and potential reversals, offering traders a more nuanced understanding of market dynamics and reducing the likelihood of false signals or fakeouts.
Key Features
Consecutive Rolling Moving Averages: Utilizes three distinct simple moving averages (SMAs) calculated over consecutive, non-overlapping windows to capture different historical segments of price data.
Dynamic Color-Coded Visualization: SMA lines change color and style based on the relationship between the averages, highlighting both extreme and normal market conditions.
Median and Secondary Median Lines: Provides additional layers of price distribution insight during normal trend conditions through the plotting of primary and secondary median lines.
Fakeout Prevention: Filters out short-term volatility and sharp price movements by requiring consistent historical alignment of multiple moving averages.
Customizable Parameters: Offers flexibility to adjust SMA window lengths and line extensions to align with various trading strategies and timeframes.
Real-Time Updates with Historical Context: Continuously recalculates and updates SMA lines based on comparative historical windows, ensuring that the indicator reflects both current and past market conditions.
Inputs & Settings
Rolling Window Lengths:
Window 1 Length (Most Recent) Bars: Number of bars used to calculate the most recent SMA. (Default: 5, Range: 2–300)
Window 2 Length (Preceding) Bars: Number of bars for the second SMA, shifted by Window 1. (Default: 8, Range: 2–300)
Window 3 Length (Third Rolling) Bars: Number of bars for the third SMA, shifted by the combined lengths of Window 1 and Window 2. (Default: 13, Range: 2–300)
Horizontal Line Extension:
Horizontal Line Extension (Bars): Determines how far each SMA line extends horizontally on the chart. (Default: 10 bars, Range: 1–100)
Functionality and Theory
1. Calculating Consecutive Simple Moving Averages (SMAs):
The indicator calculates three SMAs, each based on distinct and consecutive historical windows of price data. This approach contrasts with traditional MAs that continuously update with each new price bar, offering a static view of past trends rather than an ongoing one.
Mean1 (SMA1): Calculated over the most recent Window 1 Length bars. Represents the short-term trend.
Mean1=∑i=1N1CloseiN1
Mean1=N1∑i=1N1Closei
Where N1N1 is the length of Window 1.
Mean2 (SMA2): Calculated over the preceding Window 2 Length bars, shifted back by Window 1 Length bars. Represents the medium-term trend.
\text{Mean2} = \frac{\sum_{i=1}^{N_2} \text{Close}_{i + N_1}}}{N_2}
Where N2N2 is the length of Window 2.
Mean3 (SMA3): Calculated over the third rolling Window 3 Length bars, shifted back by the combined lengths of Window 1 and Window 2 bars. Represents the long-term trend.
\text{Mean3} = \frac{\sum_{i=1}^{N_3} \text{Close}_{i + N_1 + N_2}}}{N_3}
Where N3N3 is the length of Window 3.
2. Determining Market Conditions:
The relationship between the three SMAs categorizes the market condition into either extreme or normal states, enabling traders to quickly assess trend strength and potential reversals.
Extreme Bullish:
Mean3Mean2>Mean1
Mean3>Mean2>Mean1
Indicates a strong and sustained downward trend. SMA lines are colored purple and styled as dashed lines.
Normal Bullish:
Mean1>Mean2andnot in extreme bullish condition
Mean1>Mean2andnot in extreme bullish condition
Indicates a standard upward trend. SMA lines are colored green and styled as solid lines.
Normal Bearish:
Mean1Mean2>Mean1
Mean3>Mean2>Mean1
Normal Bullish:
Mean1>Mean2andnot in Extreme Bullish
Mean1>Mean2andnot in Extreme Bullish
Normal Bearish:
Mean1 Mean2 > Mean3
Visualization: All three SMAs are displayed as gold dashed lines.
Median Lines: Not displayed to maintain chart clarity.
Interpretation: Indicates a strong and sustained upward trend. Traders may consider entering long positions, confident in the trend's strength without the distraction of additional lines.
2. Normal Bullish Condition:
SMAs Alignment: Mean1 > Mean2 (not in extreme condition)
Visualization: Mean1 and Mean2 are green solid lines; Mean3 is gray.
Median Lines: A thin blue dotted median line is plotted between Mean1 and Mean2, with two additional thin blue dashed lines as secondary medians.
Interpretation: Confirms an upward trend while providing deeper insights into price distribution. Traders can use the median and secondary median lines to identify optimal entry points and manage risk more effectively.
3. Extreme Bearish Condition:
SMAs Alignment: Mean3 > Mean2 > Mean1
Visualization: All three SMAs are displayed as purple dashed lines.
Median Lines: Not displayed to maintain chart clarity.
Interpretation: Indicates a strong and sustained downward trend. Traders may consider entering short positions, confident in the trend's strength without the distraction of additional lines.
4. Normal Bearish Condition:
SMAs Alignment: Mean1 < Mean2 (not in extreme condition)
Visualization: Mean1 and Mean2 are red solid lines; Mean3 is gray.
Median Lines: A thin blue dotted median line is plotted between Mean1 and Mean2, with two additional thin blue dashed lines as secondary medians.
Interpretation: Confirms a downward trend while providing deeper insights into price distribution. Traders can use the median and secondary median lines to identify optimal entry points and manage risk more effectively.
Customization and Flexibility
The Price Imbalance as Consecutive Levels of Averages indicator is highly adaptable, allowing traders to tailor it to their specific trading styles and market conditions through adjustable parameters:
SMA Window Lengths: Modify the lengths of Window 1, Window 2, and Window 3 to capture different historical trend segments, whether focusing on short-term fluctuations or long-term movements.
Line Extension: Adjust the horizontal extension of SMA and median lines to align with different trading horizons and chart preferences.
Color and Style Preferences: While default colors and styles are optimized for clarity, traders can customize these elements to match their personal chart aesthetics and enhance visual differentiation.
This flexibility ensures that the indicator remains versatile and applicable across various markets, asset classes, and trading strategies, providing valuable insights tailored to individual trading needs.
Conclusion
The Price Imbalance as Consecutive Levels of Averages indicator offers a comprehensive and innovative approach to analyzing price trends and imbalances within financial markets. By utilizing three consecutive, non-overlapping SMAs and incorporating median lines during normal trend conditions, the indicator provides clear and actionable insights into trend strength and price distribution. Its unique design leverages comparative historical data, distinguishing it from traditional moving averages and enhancing its utility in identifying genuine market movements while minimizing false signals. This dynamic and customizable tool empowers traders to refine their technical analysis, optimize their trading strategies, and navigate the markets with greater confidence and precision.
